Data visualization is the discipline of trying to understand data information by placing it in a visual context so that patterns and trends that might not be detected easily will appear.
In this article I will describe step by step how to create a visualization using Roassal30 in a beginner friendly way. In addition we will show how we can turn a script in a visualization class with powerful customization hooks. Finally we will show how we can extend the object inspector with a new dedicated visualization. Doing so we show (1) how specific domains can be represented differently and specifically and (2) how domain objects can be navigated using diverse representations (lists, table, visualization).
Who is this article for?
The audience of this article:
- Data scientists – readers familiar with Pharo.
- Designers of visualization engines will find valuable resources regarding the design and implementation of a visualization engine.
Getting started with Roassal30
Roassal is a visualization engine developed in Pharo (http://pharo.org). Roassal offers a simple API. It shares similarities of other visualization engines like Mathplotlib and D3.js. Roassal3.0 produces naturally interactive visualizations to directly explore and operate on the represented domain object (https://link.springer.com/book/10.1007/978-1-4842-7161-2). Roassal 2’s documentation is available at (http://agilevisualization.com).
To use, it download the lasted stable version, currently Pharo10. Roassal3.0 is integrated in the Pharo environment, now if you want to use the last version of Roassal, select the menu item
Library >> Roassal3 >> Load full version
Loading Roassal should take a few seconds, depending on your Internet connection.
Visualizing a class hierarchy
Roassal provides examples as scripts directly executable in the Playground. We will start by designing a new visualization as a large script and in the following section we will turn into a class.
The following example, display the full hierarchy of a class with shapes whose size and colors depend on the class they represent. Evaluate the following example with Cmd+D
data := Collection withAllSubclasses.

boxes := data collect: [ :class |
	RSBox new
		model: class;
		popup;
		draggable;
		yourself ].

canvas := RSCanvas new.
canvas addAll: boxes.

RSNormalizer size
	from: 10;
	to: 100;
	shapes: boxes;
	normalize: #linesOfCode.

RSNormalizer color
	from: Color blue;
	to: Color red;
	shapes: boxes;
	normalize: #linesOfCode.

RSLineBuilder orthoVertical
	withVerticalAttachPoint;
	shapes: boxes;
	connectFrom: #superclass.

RSTreeLayout on: boxes.

canvas @ RSCanvasController.
canvas.
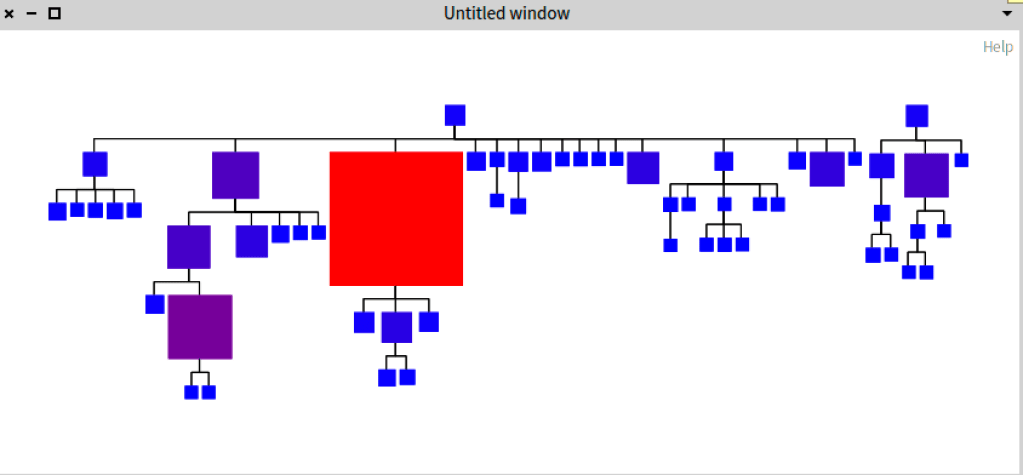
The execution of the previous script will produce the next image


This visualization shows a hierarchy of boxes, where each box is the graphical representation of a class. The width, height and color represent the size of the lines of code of the class. The lines show the connection or relationship between each class. In this case the connection is to the superclass of each class. The type of these lines is orthogonal vertical line. The position of each box shows a nice tree structure for the Collection with all subclasses.
Let’s analyse each part of the script:
Collecting data: getting a model for the visualization
data := Collection withAllSubclasses.
Usually when you are building a visualization, you use a group of objects, or collection of data. In this case our data is a collection of classes, but you can use CSV files, sql databases, or objects. In some cases you should preprocess your data before visualize it.
Generating shapes
Roassal uses several basic shapes to create the visualization, like RSBox, RSEllipse, RSLabel, RSLine, and RSComposite to combine them.
boxes := data collect: [ :class |
	RSBox new
		model: class;
		popup;
		draggable;
		yourself ].
This script creates a drawable box shape for each class. This box has a model (the class it represents). In addition this code puts a popup and a drag and drop interactions.
Creating the canvas
In Roassal, an instance of RSCanvas is the default container of shapes to show your shapes. When you want to show a shape, create it and then add it into the canvas.
canvas := RSCanvas new.
canvas addAll: boxes.
Normalization
To understand the relation between our data or to stress an aspect, sometimes it is necessary to apply a normalization or transformation for some properties of the visual elements, like the width, height, color, etc.
RSNormalizer size
	from: 10;
	to: 100;
	shapes: boxes;
	normalize: #linesOfCode.

RSNormalizer color
	from: Color blue;
	to: Color red;
	shapes: boxes;
	normalize: #linesOfCode.
In this example we are using lines of code for each class to represent the color and the size of each box.
- RSNormalizer size returns an instance of RSNormalizer, this object can modify the size(width and height) property for a group of shapes.
- The methods from: and to: define the values from the minimum and the maximum values from the collection of shapes. That means that for the class that have the minimum number of lines of code the size of that box will be 10. And for the class with the maximum number of lines of code the size will be 100.
- We use normalize: message to apply the transformation on each shape, using a block or method that takes as argument the model of each shape.
Lines
To show links between these boxes we can use lines.
RSLineBuilder orthoVertical
	withVerticalAttachPoint;
	shapes: boxes;
	connectFrom: #superclass.
A line builder has many parameters to create and add new lines to the canvas.
- RSLineBuilder orthoVertical returns an instance of RSLineBuilder, orthoVertical, is the type of line that we want to use, we can use line, or bezier or etc.
- withVerticalAttachPoint creates an attach point. This object knows the starting and ending point for the line.
- This builder interacts with a group of shapes so we set it using the message shapes:.
- connectFrom: is the method that will apply the builder and will generate new lines between the group of boxes, using #superclass for each box’s model.
If need it you can use directly the basic shapes RSLine or RSPolyline for some specific scenarios.
Layout
Finally a good visualization needs to put each element in the correct position by using a layout.
RSTreeLayout on: boxes.

canvas @ RSCanvasController.
canvas.
Roassal layout is an object that changes the position of shapes when the method on: is executed. You can use RSTreeLayout, RSVerticalLineLayout, RSHorizontalLineLayout, etc. There are many layouts in Roassal that you can use. You can also define your own layouts in case the default ones are not enough.
RSCanvasController puts basic interactions in the canvas, for zoom in or zoom out and navigate into the canvas. And the last line is the canvas itself to inspect it on the playground.
The next step: convert a script into a class
Using a script to prototype a visualization is handy and fast. However, it does not scale in terms of reusability and customization.
To reuse this code we need to create a class, there are many ways to do it. We suggest to create a subclass of RSAbstractContainerBuilder. Builders in Roassal, create a group of shapes set the interaction events and put each element in the correct position and they add the shapes into a canvas.
Create a Demo package in the system browser and then a new class TreeClassBuilder, this new class will create the same visualization as the script.
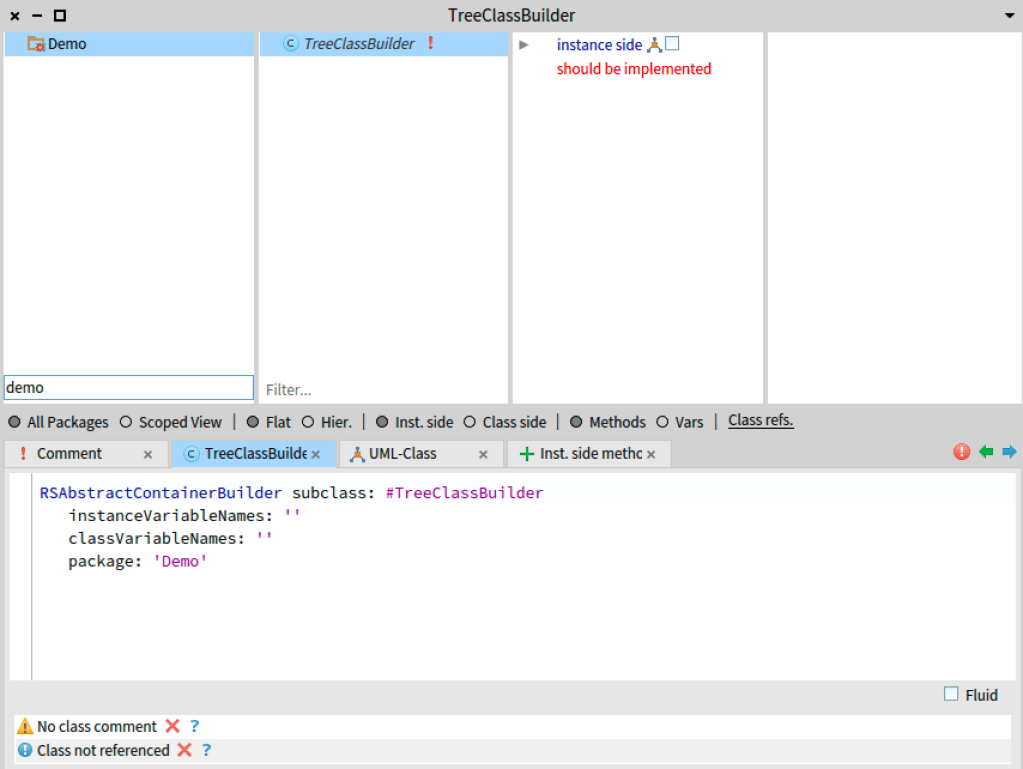
We should implement the method renderIn:. If we copy the previous script, but we omit the creation of the canvas, and then we declare the local variables and the we use the text code formatter, the method will be:
"hooks"
TreeClassBuilder >> renderIn: canvas

	| data boxes |
	data := Collection withAllSubclasses.

	boxes := data collect: [ :class |
		         RSBox new
			         model: class;
			         popup;
			         draggable;
			         yourself ].

	canvas addAll: boxes.

	RSNormalizer size
		from: 10;
		to: 100;
		shapes: boxes;
		normalize: #linesOfCode.

	RSNormalizer color
		from: Color blue;
		to: Color red;
		shapes: boxes;
		normalize: #linesOfCode.

	RSLineBuilder orthoVertical
		withVerticalAttachPoint;
		color: Color black;
		shapes: boxes;
		connectFrom: #superclass.

	RSTreeLayout on: boxes.

	canvas @ RSCanvasController.
	canvas
To test it in a playground execute this line: TreeClassBuilder new open. It will open a window with the same visualization as before. That means that open method calls renderIn: method.
Now we would like to customise each part of the script, for example different domain model(data), different shapes, different transformations. or lines, or event layout, using OOP.
Test driven development
It is a good practice to use test cases, to create the test class, right-click over the class name and click over Jump to test class. Then we get the class TreeClassBuilderTest
We will need some tests, like the test that opens the window but this test needs to close/delete the opened window.
"tests"
TreeClassBuilderTest >> testOpen
	| builder window |
	builder := TreeClassBuilder new.
	window := builder open.
	window delete.
Creating new methods with Unit Tests
Create a new test to change the domain classes, because currently the visualization is using Collection withAllSubclasses
"tests"
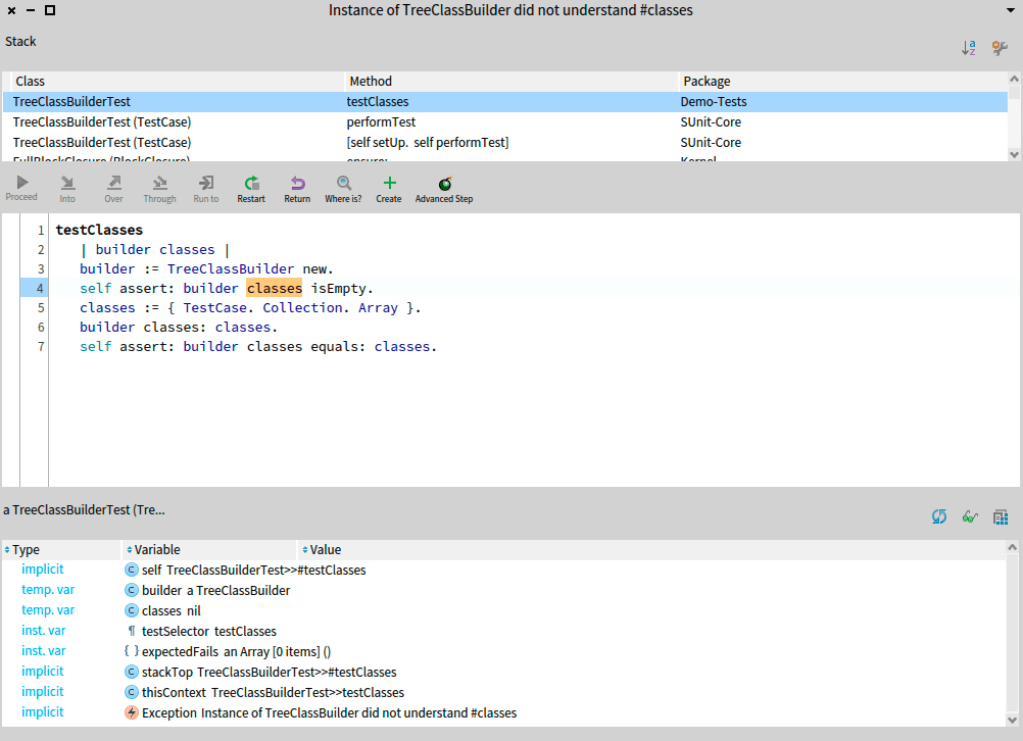
TreeClassBuilderTest >> testClasses
| builder classes |
builder := TreeClassBuilder new.
self assert: builder classes isEmpty.
classes := { TestCase. Collection. Array }.
builder classes: classes.
self assert: builder classes equals: classes.
If we execute this test will fail. Because we do not have the accessor method for classes.
Using the debugger we can generate this this getter method, using the button Create, first we select the TreeClassBuilder, then we select/write the accessing protocol for the new method.
We return an instance variable classes,
"accessing"
TreeClassBuilder >> classes
	^ classes
Then click on Proceed button on the debugger. We will have a new error: classes is nil. To solve it we can define a default value in the initialize method. Browse the class TreeClassBuilder and create initialize method as follow:
"initialization"
TreeClassBuilder >> initialize
	super initialize.
	classes := #().
Then we define the setter method.
"accessing"
TreeClassBuilder >> classes: aCollectionOfClasses
	classes := aCollectionOfClasses
Finally our test is green, viva viva!
Now we need to change and separate the renderIn: method into different methods. Because:
- Big methods are hard to understand.
- Big methods are hard to customise.
- We can create test for each new method.
- We can reuse code creating small methods.
Overriding methods allow us to extent the class functionalities, adding new functionalities in the future with new classes.
Then renderIn: method would be:
"hooks"
TreeClassBuilder >> renderIn: canvas
	| boxes lines |
	boxes := self createBoxes.
	self normalize: boxes.
	lines := self createLinesFor: boxes.
	self layout: boxes.
	canvas
		addAll: lines;
		addAll: boxes
As you can see each part of the visualization is now in a method.
"hooks"
TreeClassBuilder >> createBoxes
	^ self classes collect: [ :class | self createBoxFor: class ]
"hooks"
TreeClassBuilder >> createBoxFor: aClass
	^ RSBox new
		model: aClass;
		popup;
		draggable;
		yourself
"hooks"
TreeClassBuilder >> normalize: aGroupOfBoxes
	RSNormalizer size
		from: 10;
		to: 100;
		shapes: aGroupOfBoxes;
		normalize: #linesOfCode.

	RSNormalizer color
		from: Color blue;
		to: Color red;
		shapes: aGroupOfBoxes;
		normalize: #linesOfCode.
"hooks"
TreeClassBuilder >> createLinesFor: boxes
	| lineBuilder |
	lineBuilder := RSLineBuilder orthoVertical.
	lineBuilder
		withVerticalAttachPoint;
		color: Color black;
		shapes: boxes.
	^ lineBuilder connectFrom: #superclass.
"hooks"
TreeClassBuilder >> layout: aGroupOfBoxes
	RSTreeLayout on: aGroupOfBoxes
"accessing - defaults"
TreeClassBuilder >> defaultContainer
	^ RSCanvas new @ RSCanvasController
Now lets try to use it in a playground with different data. Here we display two hierarchies one of ArrayedCollection and other of SliderMorph.
builder := TreeClassBuilder new.
builder classes: ArrayedCollection withAllSubclasses, SliderMorph withAllSubclasses.
builder asPresenter open
Inspector Integration
The inspector is a central tool in Pharo as it allow one to (i) see the internal representation of an object, (ii) intimately interact with an object through an evaluation panel, and (iii) get specific visual representations of an object. These three properties and the fact that developers can define their own visualizations or representations of a given object makes the inspector a really powerful tool. In addition the inspector navigation will let the user smoothly walk through the objects each of them via specific or generic representations.
In this case our data domain are classes, we can define an inspector pane to show the hierarchy. Open the class Class in the system browser, then add the following method:
"*Demo"
Class >> inspectorTreeBuilder
	<inspectorPresentationOrder: 1 title: 'Subclass Hierarchy'>

	^ TreeClassBuilder new
		classes: self withAllSubclasses;
		asPresenter
The previous method is an extension method, for the package Demo, this means that the source code of this method will be save in the Demo package. By using the pragma <inspectorPresentationOrder:title:>, Pharo developers can define a new view pane for that object in the inspector.
Also because our TreeClassBuilder is subclass of RSAbstractContainerBuilder, you can use the method asPresenter. Now execute: Collection inspect
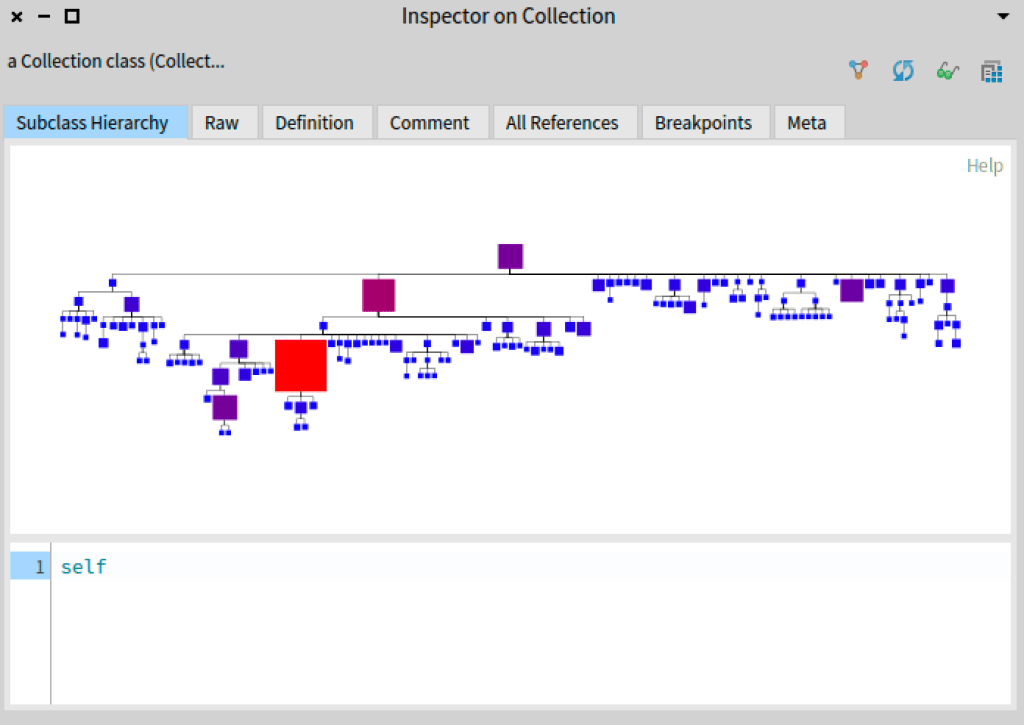
If you click over one box you will see the subclass hierarchy for the selected box in a new inspector pane.
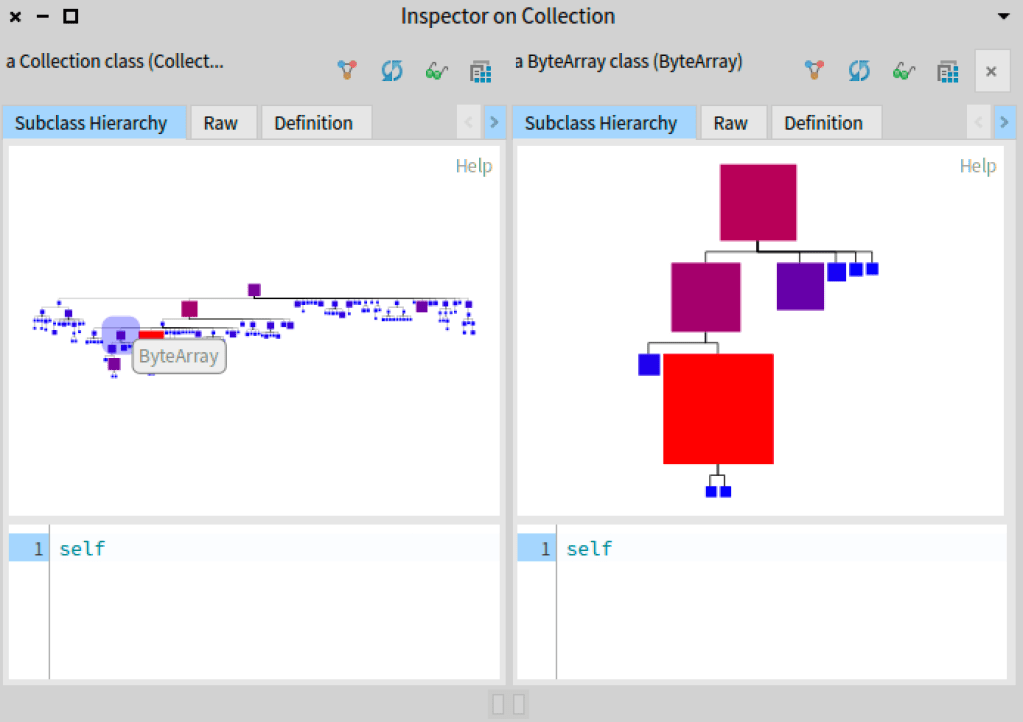
With the approach presented in this article, you can extent any of your domain objects or event the ones offered by the system and have different views of the same object.
The inspector and its specific panes let the user navigation from one visualization to another. Such interaction and navigation constitute a context to ease the manipulation and understanding of domain or objects.
Export the visualization to other formats
To export in other image formats like PNG, PDF, SVG, we need the project Roassal3Exporters, use the next incantation in a playground:
Metacello new
    baseline: 'Roassal3Exporters';
    repository: 'github://ObjectProfile/Roassal3Exporters';
    load.
After that we need to reopen the inspector. And we will find a new toolbar button

The button will open a file chooser window where we can use SVG, PNG or PDF file formats
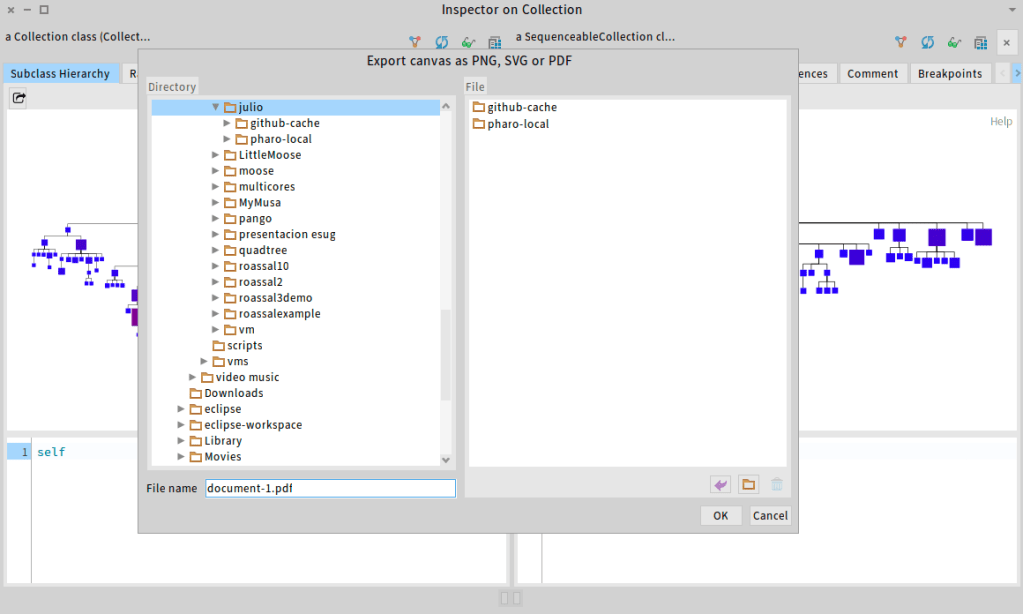
The next pdf document was created by the exporter
You can use more file formats with different constraints. like html using https://aframe.io/ or mp4 files o video files with transparency using https://ffmpeg.org/.
Share the code in Github
Finally, to share our cool project with the people we will need to create a repository in a git server like Github.
Please visit this link: https://github.com/pharo-vcs/iceberg/wiki/Tutorial, to know how to publish use Iceberg.
In order to publish a project it is good idea to create a baseline check this link https://github.com/pharo-open-documentation/pharo-wiki/blob/master/General/Baselines.md
This project is in the Github repository https://github.com/akevalion/DemoClassBuilder, please follow the readme instructions to install it and used it.
Conclusion
We saw how to create a new visualization from scratch and how it can be scaled into a class. In addition, Pharo provides many tools in the development of basic and complex applications such as: the Inspector, the Debugger, Spec, Roassal, Iceberg, etc.
We show how we can extend the environment to be able to use our new visualization.
We saw that use can use Roassal visualizations to get a different perspective on domain objects. We show that a new visualization can be tested, shared and used by other developers. You also can use projects like: Athens-Cairo, Morphic or other backends such as GTK. But Roassal offers many tools to interact manipulate and talk with your object data.
