Did you ever want to get the value of an expression each time you navigate the debugger stack? This is what we will show in this tutorial: you’ll learn how to implement a new extension for the StDebugger in Pharo9.0: the ‘Expression Evaluator StDebugger Extension’ (or simply EvaluatorDebugger for short) – that allows the evaluation and inspection of an arbitrary expression in any of the available contexts.
Navigation links
I. Introduction: Outline of the debugging events and debugger extensions.
II. Tutorial Part I: Creating a basic empty debugger extension.
III. Tutorial Part II: Implementing an Expression Evaluator Debugger Extension.
The finished code can be found in its repository
I. Introduction
Debugging in Pharo 9.0
Whenever you debug something in Pharo, this is what happens.
- Pharo choses an appropriate debugger.
It’ll be the StDebugger in most scenarios. - Once a debugger is chosen by the runtime, several things happen:
- The UI object for the chosen debugger is instantiated (StDebugger).
- The Debug Process is started and a DebugSession object is instantiated.
- An action model object (StDebuggerActionModel) is instantiated.
- The associated extensions for the debugger are loaded.
The general idea is that the debugger (UI) interacts with the action model. The action model is an interface to the debug session, which owns and works over a debug process.
To understand a little bit better, here is a little explanation of each one of the actors (objects) relevant for creating a debugger extension.
I.1 StDebugger (The debugger UI)
The StDebugger class inherits from SpPresenter and acts as the main UI for the debugger. It owns the following objects:
- DebugSession.
- StDebuggerActionModel
The UI object it’s usually designed to allow the usage of the functionalities exposed by the ActionModel object.
I.2 DebugSession
The DebugSession models a debugging session by holding its state and providing a basic API to perform elemental debugging operations. It allows one, among others actions, to:
- Step the execution.
- Manipulation of Contexts.
It owns the Debug Process.
I.3 Debug Process
It’s the process that the DebugSession will work upon. It runs the debugged execution. It’s owned by the DebugSession object.
I.4 ActionModel
Your debugger extension logic should not be implemented directly in the presenter (the UI). To separate responsibilities, we code an ActionModel object, which will implement the complex execution behavior based on the Debug Session.
StDebuggerActionModel exposes all the functions that are available for the StDebugger.
I.5 StDebugger Extensions
When the StDebugger is initialized, it loads all its extensions. A debugger extension is minimally composed by the following:
- A presenter object (UI).
The UI, a subclass of SpPresenter, that allows the user the make use of the extension capabilities. Note that having just a presenter is not enough. For this object to be recognized and listed as a Debugger Extension, the class must use the Trait: TStDebuggerExtension. - An ActionModel object.
This is the object that implements and exposes all its special debugging functionalities. It’s normally owned by the extension presenter.
In this tutorial, you will create a Presenter and an ActionModel for your debugger extension.
II. Tutorial – Part I
In “Tutorial Part I”, you will develop a minimal (blank, no tests, no accessors, no debugging features yet) implementation of a debugger extension, that is integrated with the Debugger Extensions system in Pharo 9.
An blank Debugger Extension is composed by an UI and an ActionModel object .
Adding a new debugger extension for the StDebugger
The first step towards a fully featured new extension is to create an empty one that is integrated with the debugger extensions system of Pharo 9, and it’s shown among the other extensions.
You will learn how to implement the following:
- The extension UI (SpPresenter Subclass, with TStDebuggerExtension trait).
- The Extension Action Model (Your actual Debugger Extension object that exposes its functionalities).

Implementing the basics for debugger extensions
The Action Model
In your package of choice (Here called ‘EvaluatorDebugger-Base’), define a class for your debugger extension model. Name it “EvaluatorDebugger”. There are no constraints related to the design, but it is a good idea to hold a reference, to the StDebugger, the DebugSession, or whatever your extension might need.
Note: You are not developing a Debugger, but a Debugger Extension. Nonetheless, we call it EvaluatorDebugger for simplicity reasons.

Object subclass: #EvaluatorDebugger
   instanceVariableNames: 'stDebugger'
   classVariableNames: ''
   package: 'EvaluatorDebugger-Base'
Add also the accessors.
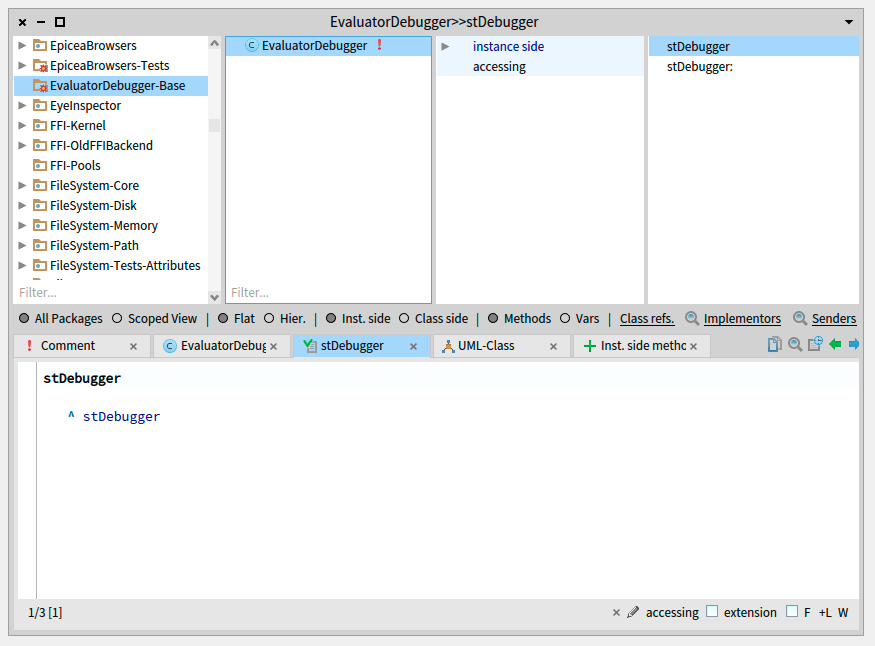
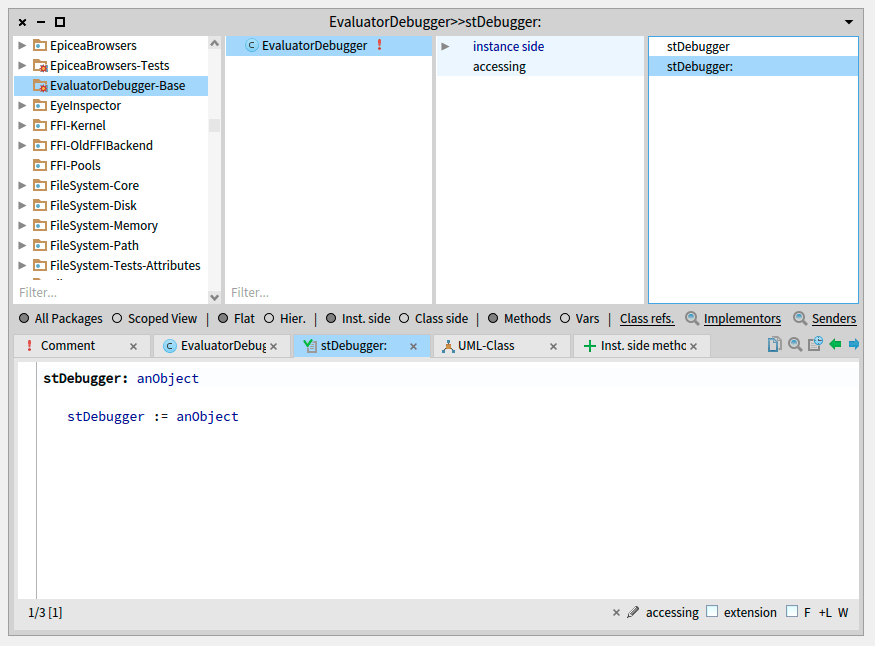
EvaluatorDebugger >> stDebugger
   ^ stDebugger

EvaluatorDebugger >> stDebugger: anObject
   stDebugger := anObject
The Extension UI
In your package of choice, create a subclass of SpPresenter that uses the trait TStDebuggerExtension. Name it “EvaluatorDebuggerPresenter”. Also, add an instance variable to hold your Action Model:

SpPresenter subclass: #EvaluatorDebuggerPresenter
   uses: TStDebuggerExtension
   instanceVariableNames: 'evaluatorDebugger'
   classVariableNames: ''
   package: 'EvaluatorDebugger-Base'
Remember to implement the trait methods; in particular, put a name to your extension.
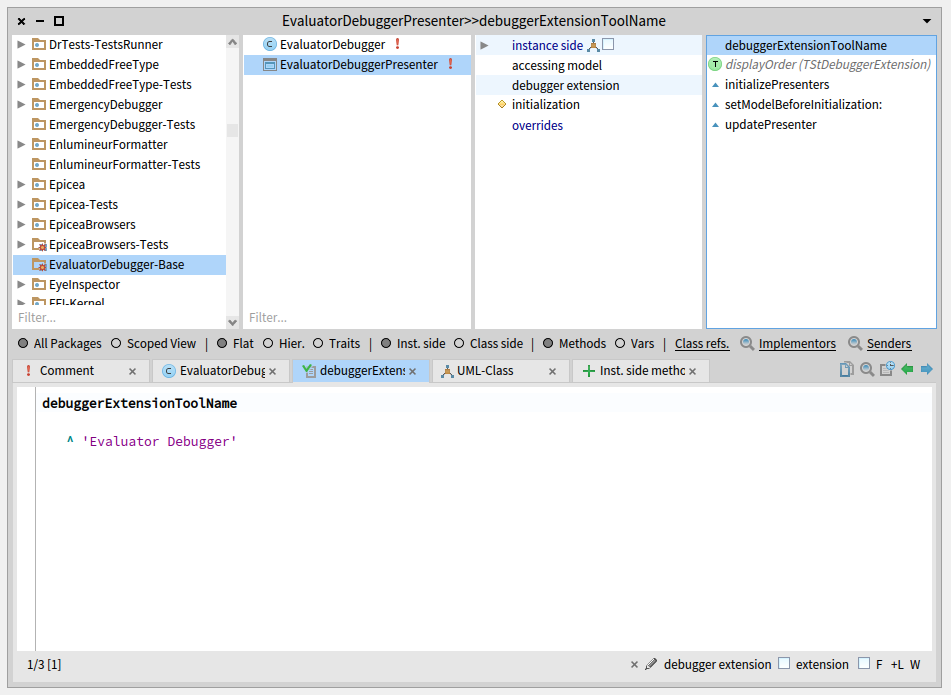
EvaluatorDebuggerPresenter >> debuggerExtensionToolName
   ^ 'Evaluator Debugger'
The Extensions system relies on certain methods to be implemented in your UI object to have a functional extension. Implement the following:
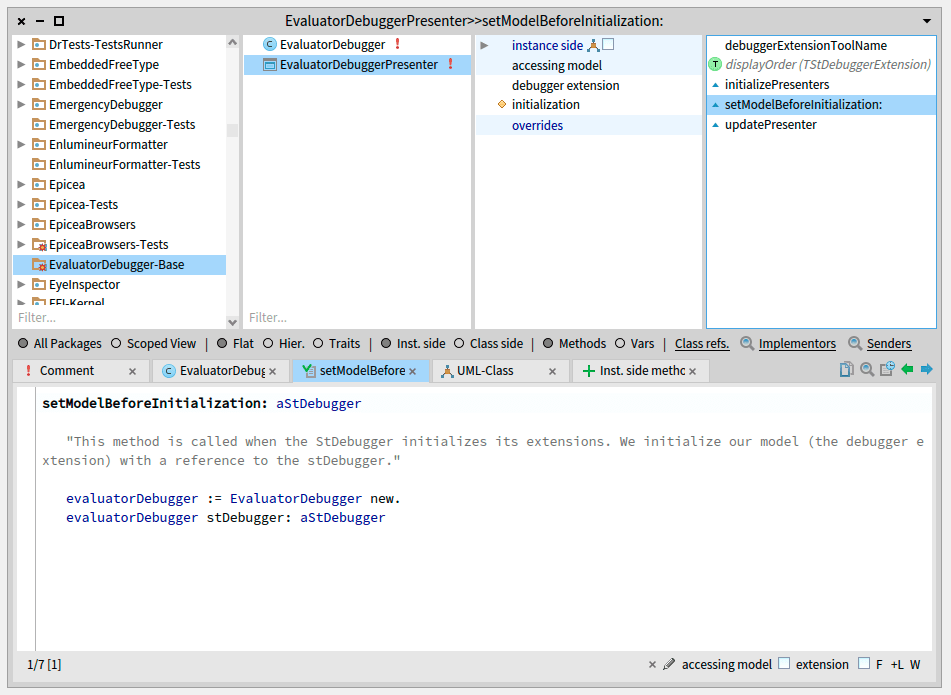
EvaluatorDebuggerPresenter >> setModelBeforeInitialization: aStDebugger
"This method is called when the StDebugger initializes its extensions.
We initialize our model (the debugger extension) with a reference to the stDebugger."
evaluatorDebugger := EvaluatorDebugger new.
evaluatorDebugger stDebugger: aStDebugger
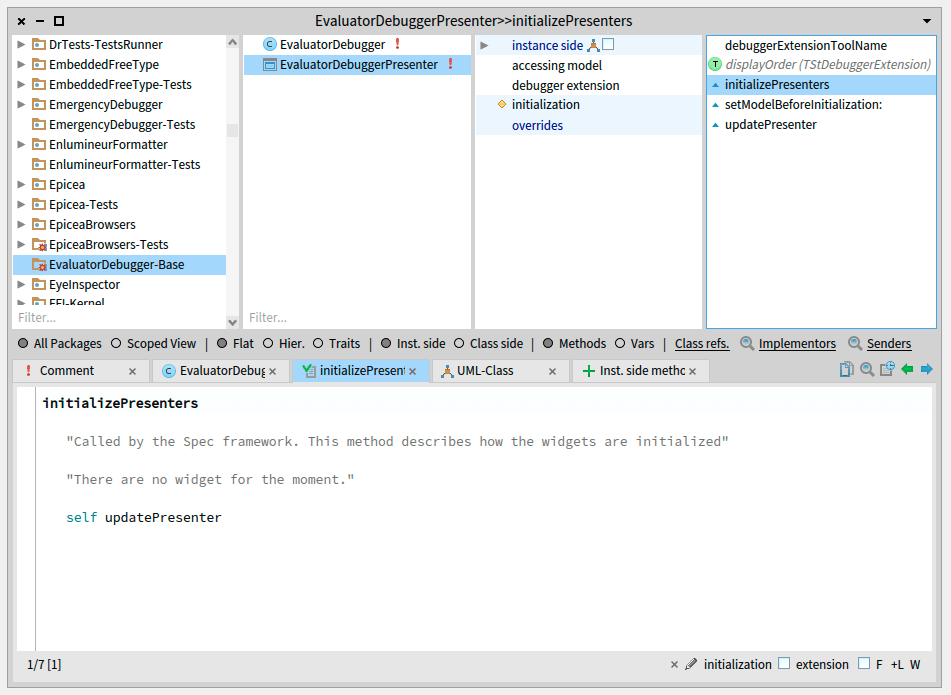
EvaluatorDebuggerPresenter >> initializePresenters
"Called automatically by the Spec framework. This method describes how the widgets are initialized"
"There are no widget for the moment."
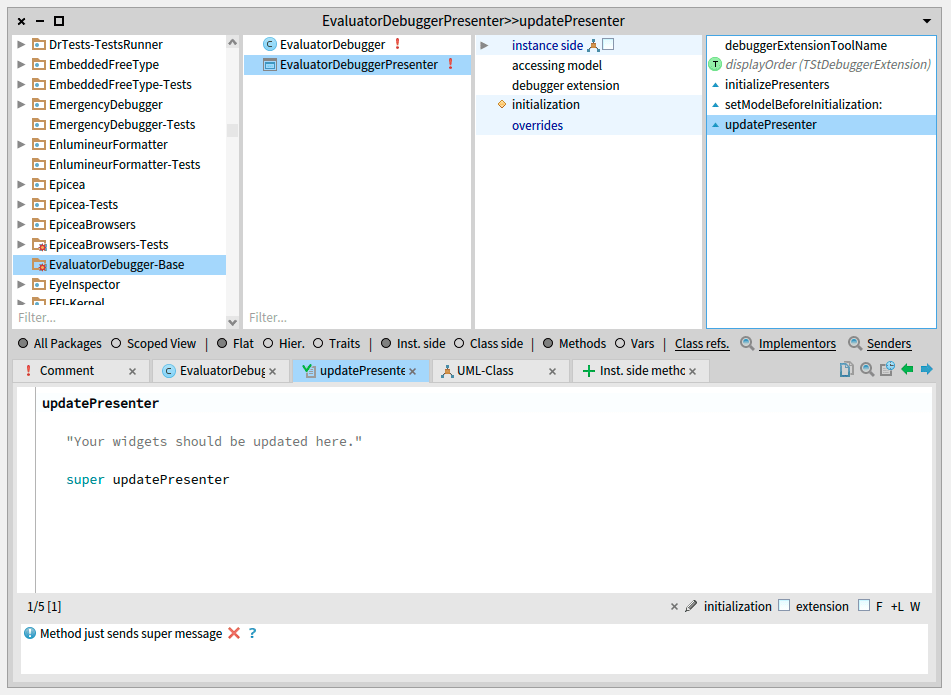
EvaluatorDebuggerPresenter >> updatePresenter
"Called automatically when the debugger updates its state after stepping"
"Your widgets should be updated here."
super updatePresenter
And in the class side, your presenter needs the following method to be implemented:
EvaluatorDebuggerPresenter class >> defaultSpec
"An empty vertical box layout, for the moment"
    ^ SpBoxLayout newVertical
So far, you have an empty debugger extension. It doesn’t do anything yet.
Next, you’ll make it appear among the other extensions.
Activate the debugger extensions in Pharo
How to see your new extension?
So far, you have a functional empty debugger extension. For it to be visible and available in the StDebugger, you need to enable the Debugger Extensions in the Pharo Settings. This is how:
- Go to the Pharo Settings.
- Navigate to Tools > Debugging > Debugger Extensions and check the option Activate Extensions…
- Expand Activate Extensions… and find your extension (Evaluator Debugger) check the option Show in Debugger.
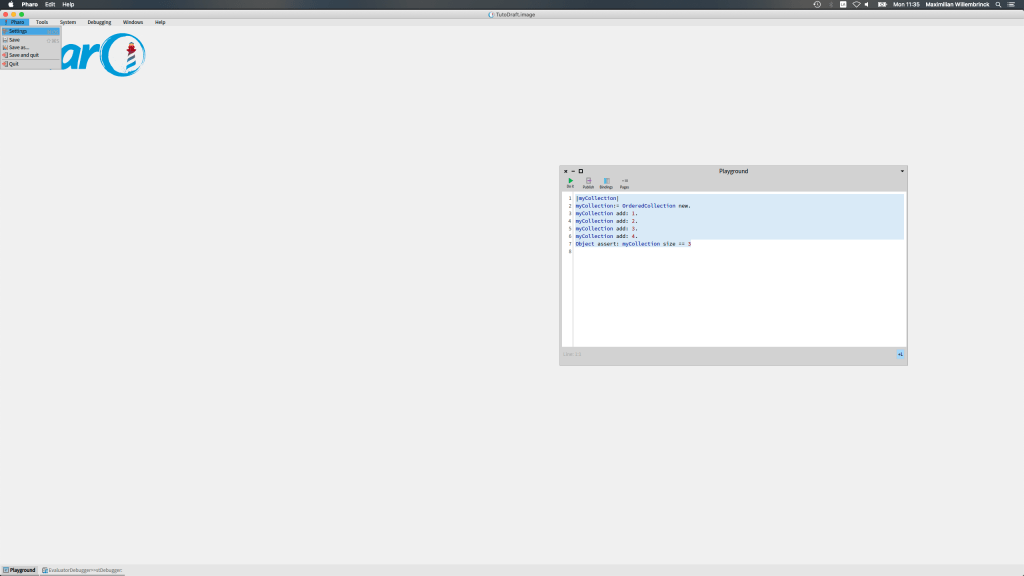
Pharo > Settings in the menu bar. 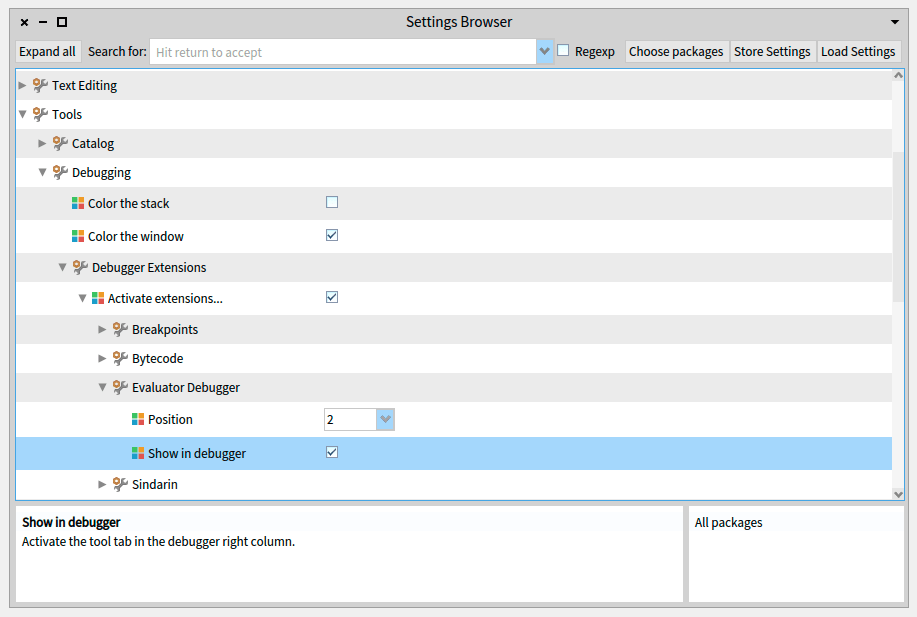
Check the options to enable extension 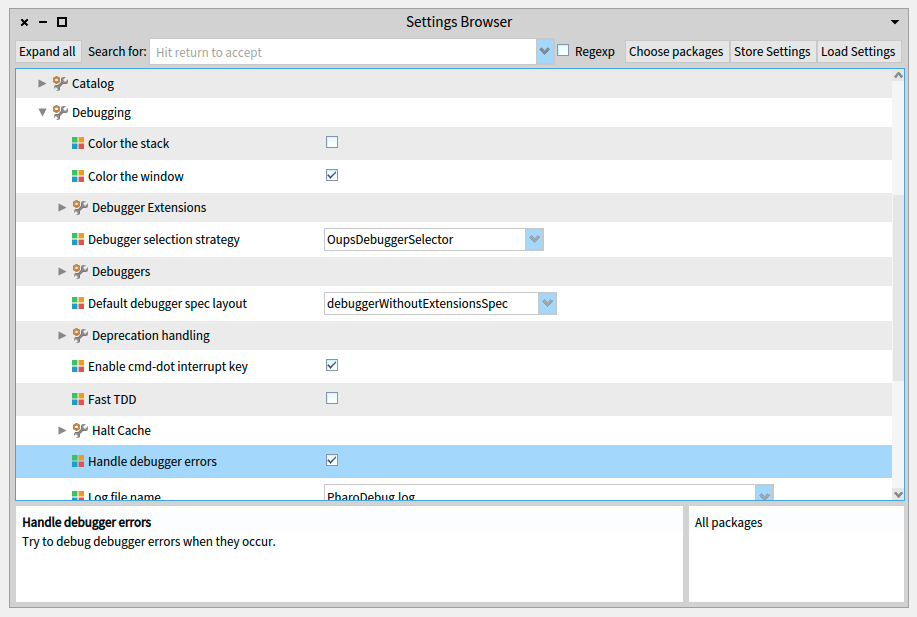
Handle Debugger Errors
Additionally When developing debugger extensions, it is recommended to enable the option to Handle Debugger Errors, like in the last picture.
By default, if your debugger extension throws an error, it will be ignored and the StDebugger will not load the extension. This means that you can’t debug your extension code directly in case of failure. By enabling Handle Debugger Errors, whenever an error is thrown in your extension, a new StDebugger(without extensions) instance will be launched so you can debug it.
For this, navigate and check the option: Tools > Debugging > Handle Debugger Errors.
From now on, whenever you debug something, your extension should appear in the top-right pane.
III. Tutorial – Part II
Implementing the Expression Evaluator StDebugger Extension
Remember: For readability purposes, in this tutorial the extension is called simply by “EvaluatorDebugger” instead of its full connotation: “Expression Evaluator StDebugger Extension”
Now you’ll add your extension functionalities. For this, you will:
- Implement the logic of your debugger extension (Implement the ActionModel – EvaluatorDebugger – methods).
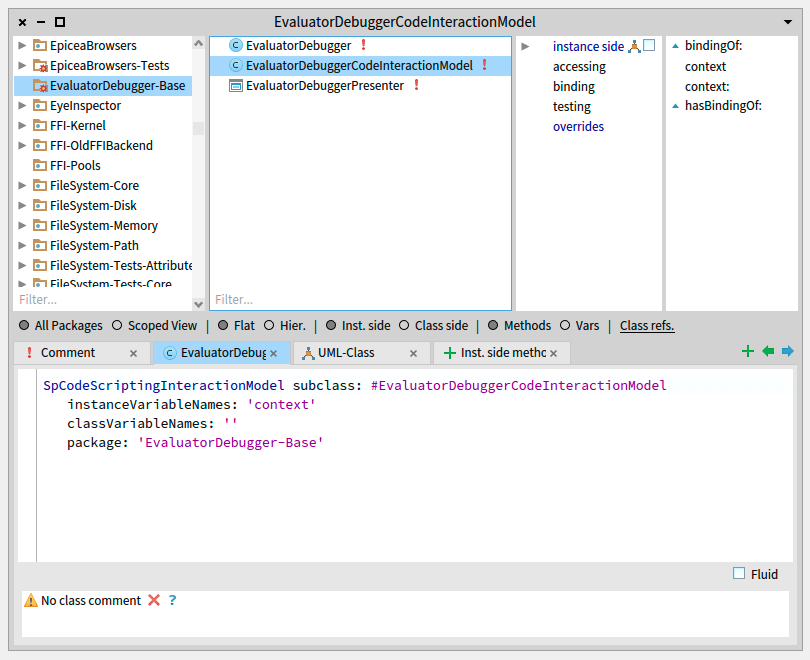
- Implement an object subclass of SpCodeScriptingInteractionModel – EvaluatorDebuggerCodeInteractionModel – needed for the expression-evaluation-in-context logic.
- Finish the UI (EvaluatorDebuggerPresenter) layout and widgets.
EvaluatorDebugger
During the Tutorial – Part I, we developed an Action Model without any behavior – The EvaluatorDebugger. This time, we will complete the class with the intended logic by adding a method that allows the evaluation of an expression in a given Context.
Add a new method: #evaluateInCurrentContextExpression:withRequestor:
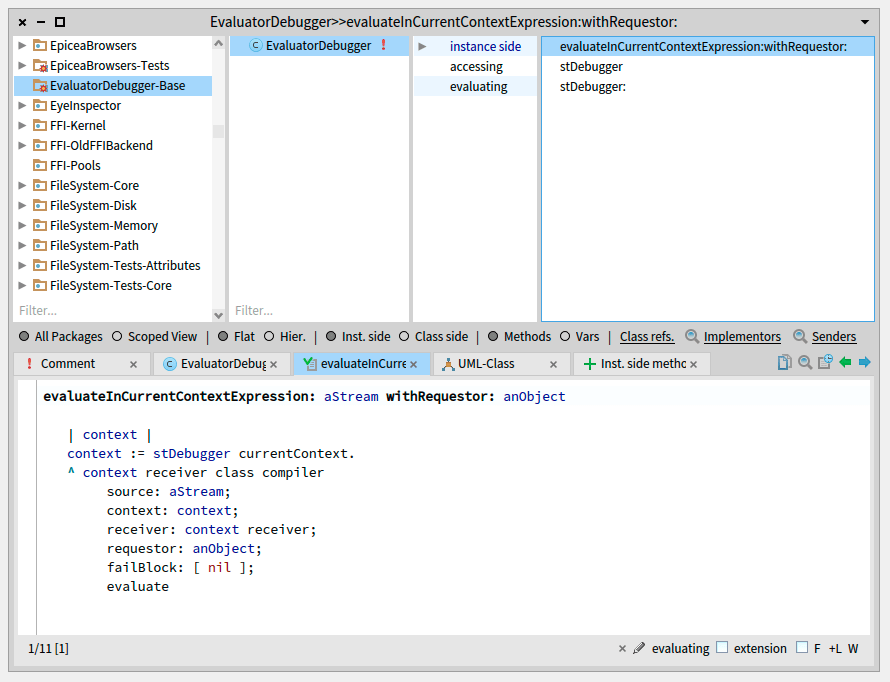
EvaluatorDebugger >> evaluateInCurrentContextExpression: aStream withRequestor: anObject
   "Evaluates the expression coming from a stream. Uses the current context of the StDebugger"
   | context |
   context := stDebugger currentContext.
   ^ context receiver class compiler
        source: aStream;
        context: context;
        receiver: context receiver;
        requestor: anObject;
        failBlock: [ nil ];
        evaluate
EvaluatorDebuggerCodeInteractionModel
Your extension UI will feature a SpCodePresenter, where the user can type an expression which is evaluated in the selected context of the StDebugger.
Your code presenter should consider the current selected context to correctly work with your code (Syntax highlighting, inspection, etc), and for this you need to implement a subclass of SpCodeScriptingInteractionModel as follows.
SpCodeScriptingInteractionModel Class code 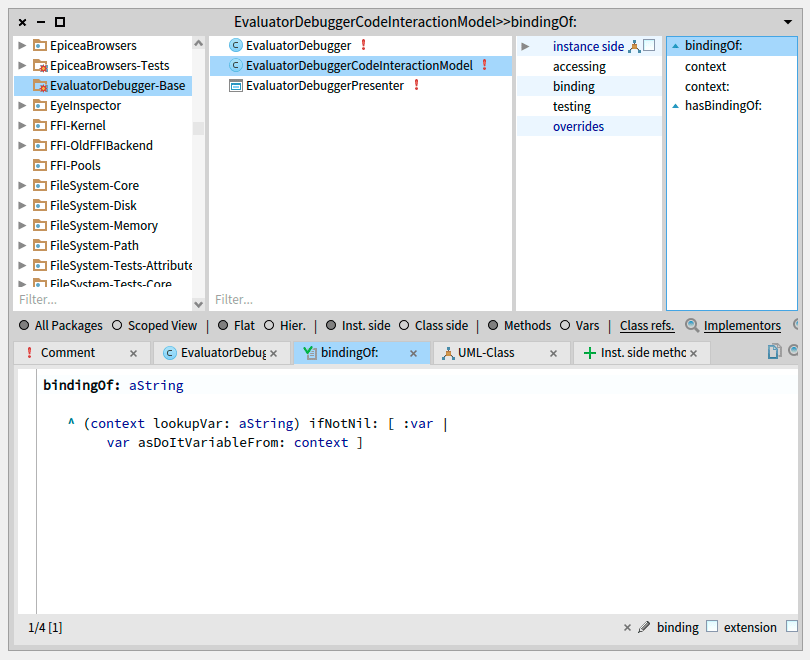
SpCodeScriptingInteractionModel>>bindingOf: 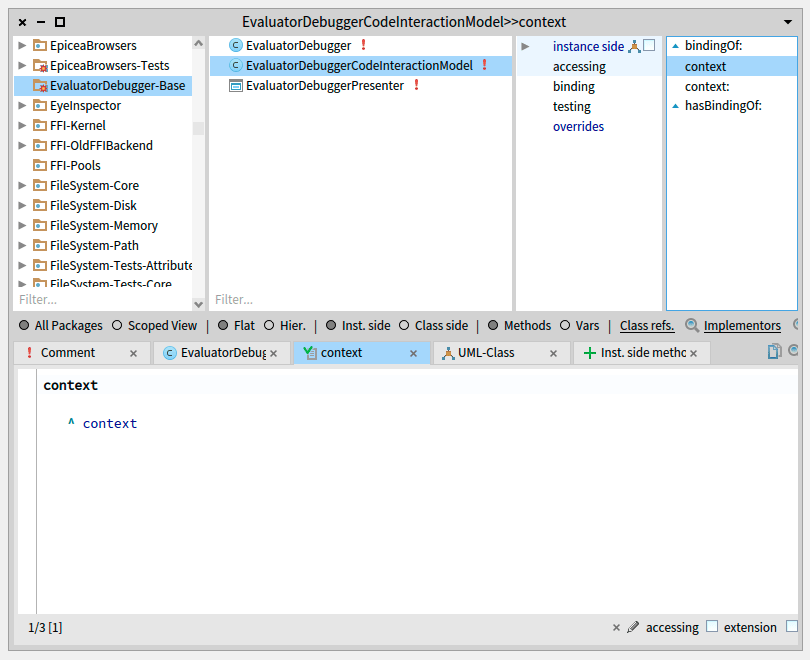
SpCodeScriptingInteractionModel>>context 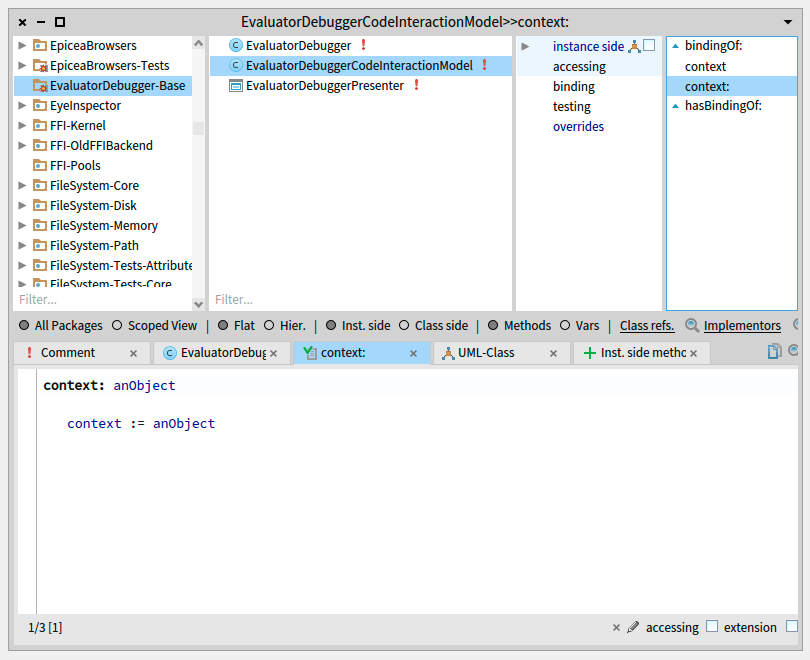
SpCodeScriptingInteractionModel>>context: 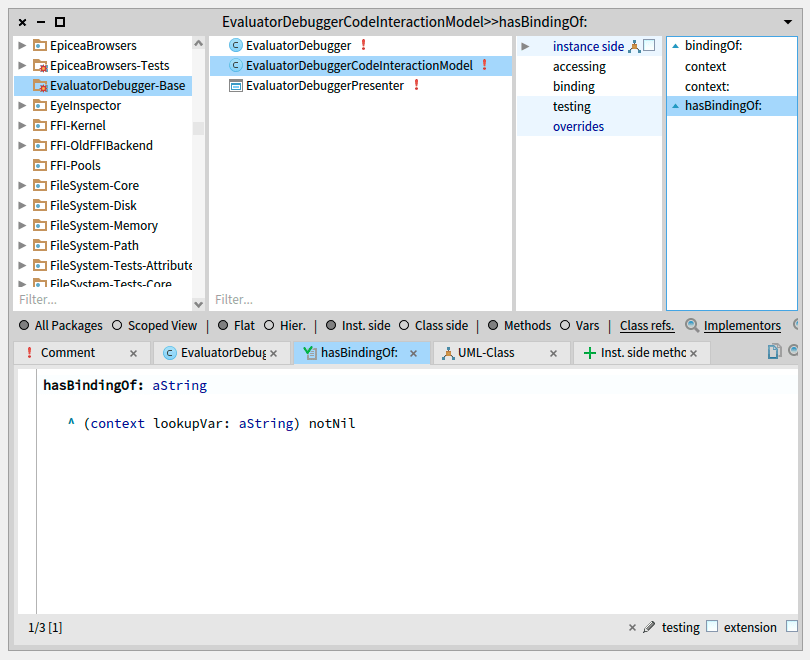
SpCodeScriptingInteractionModel>>hasBindingOf:
SpCodeScriptingInteractionModel subclass: #EvaluatorDebuggerCodeInteractionModel
   instanceVariableNames: 'context'
   classVariableNames: ''
   package: 'EvaluatorDebugger-Base'
EvaluatorDebuggerCodeInteractionModel >> bindingOf: aString
   ^ (context lookupVar: aString) ifNotNil: [ :var |
        var asDoItVariableFrom: context ]

EvaluatorDebuggerCodeInteractionModel >> context
   ^ context

EvaluatorDebuggerCodeInteractionModel >> context: anObject
   context := anObject

EvaluatorDebuggerCodeInteractionModel >> hasBindingOf: aString
   ^ (context lookupVar: aString) notNil
EvaluatorDebuggerPresenter
Finally, define the layout and behavior of the extension UI.
UI Layout
The object is a Spec-based presenter. Design a neat and practical interface!
Modify the EvaluatorDebuggerPresenter class. Add the instance variables for the widgets.

EvaluatorDebuggerPresenter class code 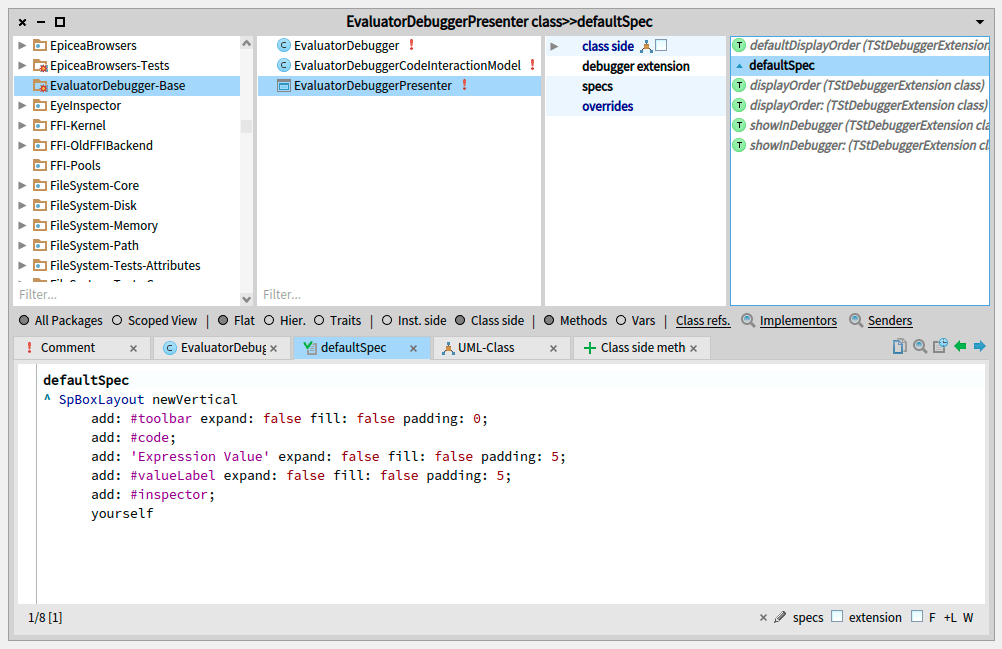
Class side #defaultSpec Method
SpPresenter subclass: #EvaluatorDebuggerPresenter
   uses: TStDebuggerExtension
   instanceVariableNames: 'toolbar code inspector valueLabel evaluatorDebugger'
   classVariableNames: ''
   package: 'EvaluatorDebugger-Base'
Define the layout in the class side as follows.
EvaluatorDebuggerPresenter class >> defaultSpec
^ SpBoxLayout newVertical
      add: #toolbar expand: false fill: false padding: 0;
      add: #code;
      add: 'Expression Value' expand: false fill: false padding: 5;
      add: #valueLabel expand: false fill: false padding: 5;
      add: #inspector;
      yourself
Implement the following instance-side methods.
EvaluatorDebuggerPresenter >> initializeCode
   "We define the extensions Code presenter initialization here"
   code := self newCode.
   code interactionModel: EvaluatorDebuggerCodeInteractionModel new.
   code syntaxHighlight: true.
   code text: '"put your expression here"'

EvaluatorDebuggerPresenter >> initializePresenters
   "Called by the Spec framework. This method describes how the widgets are initialized"
   self initializeToolbar.
   self initializeCode.

   valueLabel := self newLabel.
   valueLabel label: 'Write an expression first'.
   inspector := nil inspectionRaw.
   inspector owner: self.

   "when changing the selected context in the stDebugger stackTable, re-evaluate the expression in that context"
   evaluatorDebugger stDebugger stackTable selection whenChangedDo: [
      self updatePresenter ].
   self updatePresenter

EvaluatorDebuggerPresenter >> initializeToolbar
   toolbar := self newToolbar
                 addItem: (self newToolbarButton
                        icon: (self application iconNamed: #smallDoIt);
                        action: [ self updatePresenter ];
                        yourself);
                 yourself
Note:
‘updatePresenter’ is meant to be automatically called when the debugger updates its state after stepping, and changing the context in the stack. However, the current version of Pharo9.0 – at the date of writing 2021/02/16 – doesn’t perform the update after changing the selected context. To fix this, we used the following “hacky” code:
evaluatorDebugger stDebugger stackTable selection whenChangedDo: [
self updatePresenter ]
and add an updatePresenter call to the table selection change callbacks collection in the method initializePresenters above.
Behavior
The user will write expressions and “press buttons/click things” in the debugger and your extension, expecting something to happen. Also, the StDebugger might issue an “updatePresenter” call to all the extensions. You need to code that.
Add an accessor to directly expose the current context.
EvaluatorDebuggerPresenter >> currentStDebuggerContext
   "A 'shortcut' to get the same currentContext of the StDebugger"
   ^ evaluatorDebugger stDebugger currentContext
Remember that whenever the StDebbuger updates its state, it will automatically call updatePresenter for each of the extensions. We want the code presenter to reflect that, and also the displayed expression value.
EvaluatorDebuggerPresenter >> updatePresenter
   "Called automatically when the debugger updates its state after stepping"
   self updateCode.
   self updateExpressionValueDisplayed.
   super updatePresenter
EvaluatorDebuggerPresenter >> updateCode
   "Sets the context of our debugger-extension code presenter to be the same one of the StDebugger"
   code interactionModel context: self currentStDebuggerContext

EvaluatorDebuggerPresenter >> updateExpressionValueDisplayed
   "Evaluate the expression, in the code presenter, using the appropriate context (the current one of the stDebgger). Then update the ui to show and inspect the obtained value, or a potential exception."
   | expressionBlock expressionResult errorFlag errorMessage |
   expressionBlock := [
                      evaluatorDebugger
                         evaluateInCurrentContextExpression:
                         code text readStream
                         withRequestor: code interactionModel ].
   errorFlag := false.
   expressionResult := expressionBlock
                          on: Exception
                          do: [ :e |
                             errorFlag := true.
                             errorMessage := e description.
                             e ].
   "The inspector shows the result object in case of success, or the Exception otherwise"
   inspector model: expressionResult.
   valueLabel label: (errorFlag
          ifTrue: [ errorMessage ]
          ifFalse: [ expressionResult asString ])
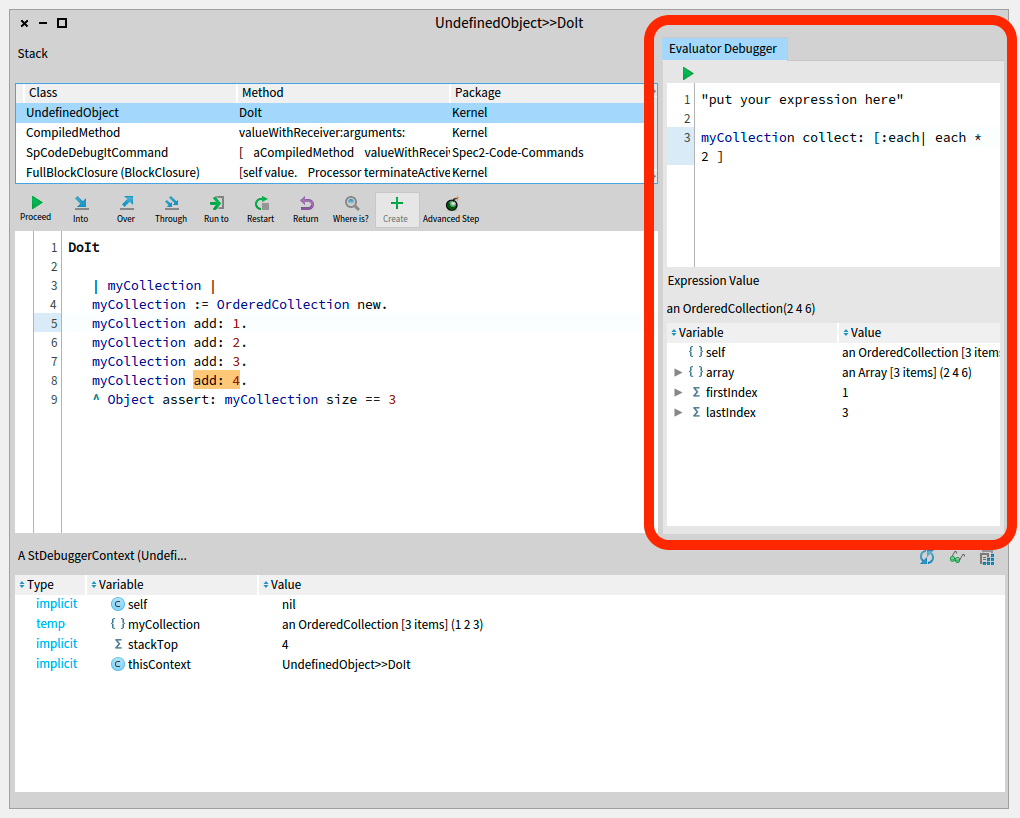
Try it!
Now you have a fully functional debugger-extension. Try debugging some code!
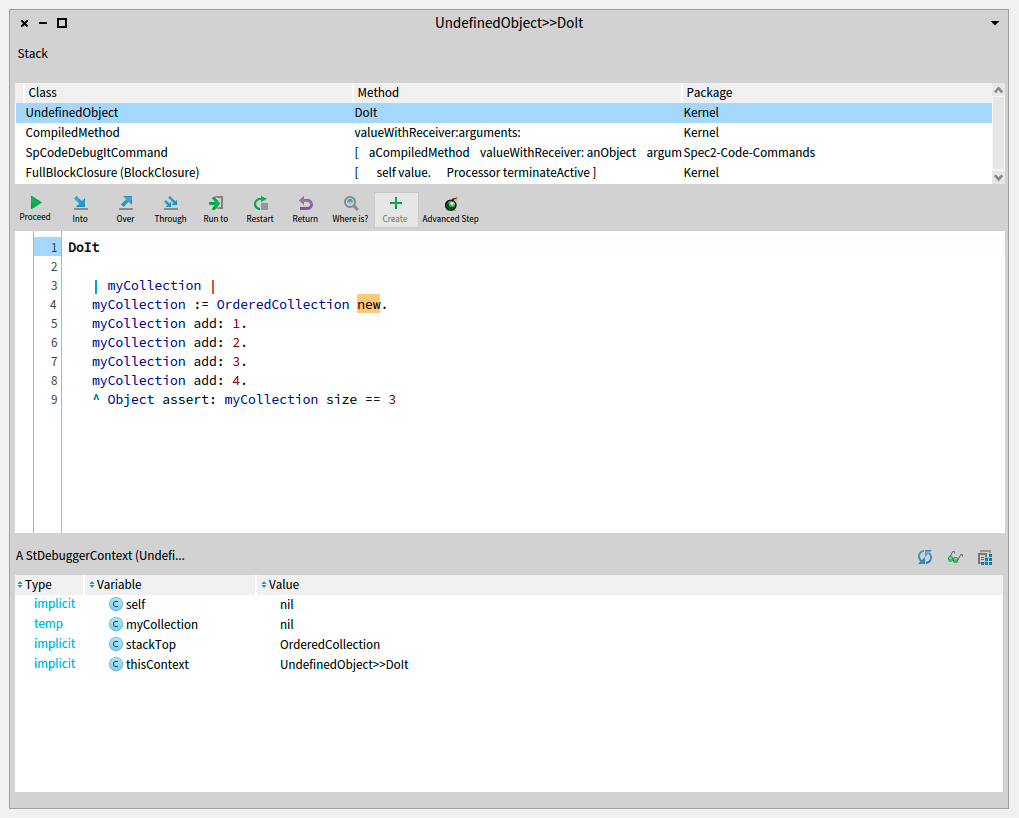
Example code to be debugged:
|myCollection|

myCollection:= OrderedCollection new.
myCollection add: 1.
myCollection add: 2.
myCollection add: 3.
myCollection add: 4.

Object assert: myCollection size == 3
- Debug some code (cmd+D in the Playground).
- Write an expression in your extension’s code presenter (try the code in the image below, if following the example).
- Select different Contexts in the stDebugger and see what happens!
Conclusion
The Pharo 9.0 debugger extensions system allows one to conveniently add new ones. The example developed in the tutorial explores all the basic aspects needed to have a functional extension completely integrated with the environment. Should you need to create a new one, or modify and existing one, now you have the knowledge.
