“What is the nature of your debugging emergency?”
—Ed.
In this post, we’ll speak about debugging emergencies due to system error handling failures. We’ll cover the current tools available to revert code changes provoking such failures and introduce Ed, the new emergency debugger with improved revert capabilities.
What is a debugging emergency?

Sometimes when you execute code, you get a strange failure that opens that window and blocks your execution. This is the emergency evaluator invite.
It says a lot of things and it is scary, and it is common to just close it as fast as possible to get back to our Pharo image and forget about it.
Unfortunately, this means that there was a system error handling failure, it may happen again, and sometimes it totally breaks your image. This is a debugging emergency!
A debugging emergency is a system error handling failure
A system error handling failure happens when the debugger cannot be opened after an exception is raised. Most of the time, this happens because an error occurs within the debugger itself, which prevents it to work properly. Consequently, the debugger cannot open to debug its own error. This is an error-handling failure.
Because the system failed to handle the error, the whole system crashes. The system falls back to the emergency evaluator invite (see above) and waits for the user to decide what to do. We are in a debugging emergency state because tools are broken (here, the debugger) but nevertheless we need to recover from that error. At this point, the only tool still able to work is the emergency evaluator.
The only tool able to deal with an error-handling failure is the emergency evaluator
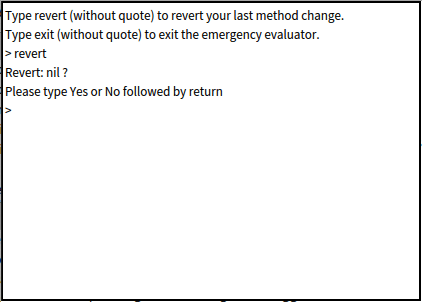
The emergency evaluator is a rudimental tool with a super limited user interface. It is started from the emergency evaluator invite. It answers to two commands only:
- revert: reverts the last modified method to the last known version of that method (in this screenshot, it just failed doing that… why?).
- exit: quits the emergency evaluator, dropping the original error.
Any other command is treated as Pharo source code: it is compiled and executed.
We need better emergency handling because current tools are limited
Emergency tools are too limited: they do not provide enough information, that information is not explorable and on top of that, they are buggy!
The first limitation is the restricted information that is given by the emergency evaluator invite. It is a printed representation of the last 20 elements of the call stack. All other debugging information is dumped, to only keep that printed stack. Because it is only printed, a lot of contextual information is lost. It is often hard to see in that stack where it crashed. The problem is that users have to rely on that information to devise what to do in the emergency evaluator!
Then comes the emergency evaluator. Its revert command is interesting. It allows us to recover from a fatal method change that provokes the error. But there are many problems. Among others, it is buggy and does not work all the time. Then, it only reverts the last modified method in the system. What if the problematic method is not the last modified one, but another one modified much before?
When reverting does not work, the only option left is to manually recompile the buggy method. This is tedious and error-prone: we have to remember the original class name, the method’s source code and rewrite it without any error. Although this is possible for simple methods, it does not scale. Finally, in case of error, the emergency evaluator will not give us any feedback and we’re left in the dark.
ED: the Emergency Debugger
Ed is an enhanced emergency evaluator that keeps as much debugging features as possible before falling back to the emergency evaluator. Ed provides a structured and navigable call stack from which users decide their debugging actions.
Ed is designed as a minimal, last-resort debugger to handle error handling failures. The goal of Ed is to provide a debugging tool with the less possible system dependencies to ensure that it can work even if almost everything else breaks.
Ed always opens on your domain code failure: it does not show you the debugger error. Your concern is to debug your code. However, it is possible to see a stack trace of the debugger failure, and to debug it with Ed.
Ed’s improved emergency stack view
Ed presents a navigable stack instead of a string representation of the stack. Instead of dropping the debug session when a system error handling failure occurs, Ed keeps it and uses it to provide us with contextual information about the failure. The stack that Ed presents is a stack of execution contexts extracted from the debug session.

The navigable stack helps us understand the error and where it originally happened:
- We can see and navigate the call stack like in a standard debugger (top pane)
- We can see the argument value (if any) printed between parentheses near each method in the call stack
- We can see the source code of the method selected in the stack (middle pane), and see exactly what expression failed or is being executed (in red)
Ed’s method version selector
For a selected method in the call stack, Ed provides access to the different versions of that method. The source code of each version is displayable and navigable. Viewing methods’ versions helps in deciding which one is the method to revert. In addition, it does not matter if the right method was the last modified method in the system. It’s highly probable that this method is somewhere in the call stack, and we can navigate the call stack!
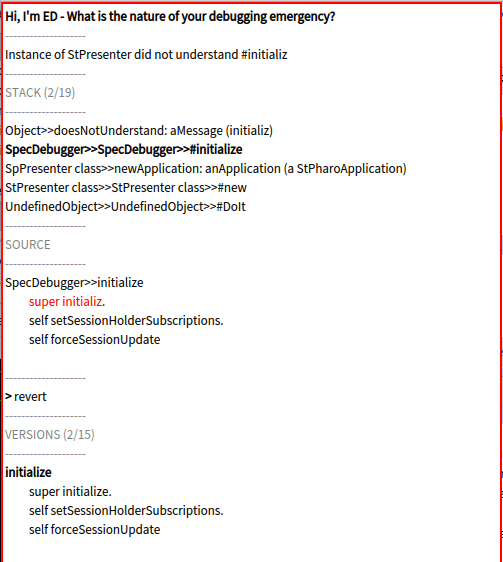
- We can see and navigate the selected stack method’s versions using left/right arrows: bottom pane shows version 2/15 of the selected method
- We can revert the method to the selected version by using the revert command
- Once a method is reverted, the retry command allows you to retry opening a real debugger on your error, and the proceed command will attempt continue execution from there.
- Any method in the stack can be selected and reverted to a previous version
What else can Ed do?
Ed provides a prompt with basic commands. For now, Ed uses a simple debugging API with minimal commands. Remember: you got here because the debugger failed while opening on an error from your domain code. So Ed just gives you another chance to debug your error. Maybe you are interested in debugging the debugger failure, in which case Ed allows you to switch context to debug that failure. It is also possible to retry the opening of the standard debugger after reverting a method or to terminate all non-vital system processes to kill potential image-breaker running code.
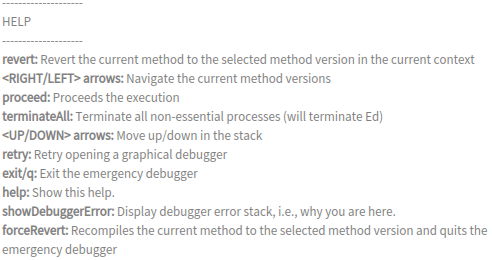
- Ed provides some help to know all available commands: type
"h" - The set of commands is provided by the debugging API of Ed
- Using the showDebuggerError command, Ed shows the debugger failure that led you here, and the debugDebugger command opens a new Ed on the debugger failure.
Can Ed fail?
Yes, it can. Any program can. In case Ed fails, the system fallsback to the original emergency evaluator. For now, a failure in Ed should not block you. For instance, imagine that you get a debugger failure while debugging an exception in your domain code. First, Ed will open on your exception (not the debugger failure) so that you can debug your code. Second, if an exception is raised from within Ed and that it breaks Ed, the emergency evaluator will open on your exception again. Debugging the debugger is not going to be on your soulders, and you can focus on your bugs!
Note that, in the future, this last part is something we are going to improve to bring more flexibility to developers. Settings will enable the debugging of debugger failures or disable them to try to always find a debugger that can debug your exceptions.
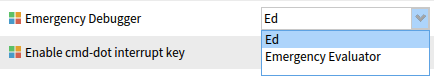
Additionaly, the default emergency debugger can now be selected in the settings. You can choose if you wish to experiment Ed or to stay with the old emergency evaluator:
Ed is a prototype, but it moves fast!
Ed is still a prototype, and it needs better testing and experimentation. For instance, it still has system dependencies that can be removed, it has code that can be improved.
In the end, the goal is also to give users a read-eval-print-loop prompt with a strong debugging API. For now, Ed only has it’s minimal emergency API. However, it has been designed in a way that its API is extensible by additional tools, improving Ed’s potential capabilities. In the future, we want to explore remote debugging with Ed. For instance, Ed could act as a minimal debugging infrastructure that you can remotely connect to through an simple http connection. And if your debugging needs grow, Ed could receive a bytecode upload containing new debugging tools and API. We will experiment and explore this in future articles about debugging IOT devices.
